Pages

Wednesday, 5 November 2014

Python tutorial: Converting a raster dataset to XYZ in Python

One of the most popular posts in my blog is about converting a raster image into XYZ text file.  Converting raster image to XYZ file may be necessary because machine learning algorithms (outside proprietary software) requires input to be a table. I had written a post about converting a raster file into XYZ using ARCGIS some three years ago, which seems to attract many visitors to my blog.

Here I will write a way to do it using Python. For reading geo-referenced raster file, we will use rasterio package which is a wrapper for gdal that provides clean and fast I/O for geospatial raster images. The package is written in cython therefore it is very fast. Reading a raster file with rasterio is a one liner code. You can download binary of rasterio here. Its a binary file so installing rasterio is just a matter of clicking binary executable file. After reading the raster file we will get bounding box of the image and compute XY of each pixel and later write in a csv file together with pixel values. The code works for any number of bands in the image.

I hope this piece of code is useful for you. In near future I will show you to do exact same thing within QGIS. Stay tuned.


Output XYZ file with band values

In addition, the above code can be combine with the code (Data exchange between MATLAB and Python: Reading and writing .mat files with Python)  so that  you can easily export multi-spectral and hyperspectral data as a mat file for MATLAB. Many people seem to be having problem with reading remote sensing image with multiband read function in MATLAB. If you are one them, use above codes and bypass multiband read function to get your remotes images straight in MATLAB.

Tuesday, 28 October 2014

eCognition tutorial: Almost connected components for clumps identification in eCognition

This post is inspired from a post by Steve Eddins, who works in Math works, a company that build MATLAB. He is a software development manager in the MATLAB and one of the co-author of a book " Digitial image processing with MATLAB".I use both MATLAB and eCognition, so I ponder if this can be done in eCognition. eCognition has basic Morphological Operators like dilation and erosion . Advance MM operators like by opening by reconstruction, connected component labeling or skeleton and many others are not available in eCognition.

The problem of almost connected components:

There is simple synthetic image containing a number of circular blobs.  How can we label and measure the three clumps instead of the smaller circles? Two circles are almost connected if circles are within 25 pixels unit.

Binary circles
Connected components labeling
Almost connected components labeling

Of course it can be solved in eCognition. But for this, you have to  be familiar with many concepts in eCognition. Concepts such as PPO, object variables, multi-level representation and temporary layers are required. My workflow for  the solution is as follows:

  • Use multi-threshold segmentation to get circles
  • Use distance map algorithm to get binary distance map
  • Use chessboard segmentation to get pixel level unclassified objects
  • Use  multi-thresholding segmentation based on the distance map to get  clump
  • Copy level above
  • Use object variable concept to assign each clump a unique ID
  • Convert to sub-objects to get original circle at upper level

I will post rule-set after some time. I have given you enough hint how to proceed. Get your hands dirty !

Almost connected components labelling within eCognition
The concept of “almost connected components” can be applicable in remote sensing for clustering buildings detected in remote sensing images for analyzing of micro-climate of urban areas. There can be various other applications. Can you think of any ?

Monday, 27 October 2014

eCognition tutorial: Image object fusion in eCognition: Example of water bodies classification

eCognition is a powerful software for analysis for remote sensing images. Many people have this false impression that eCognition is all about segmentation. That’s not true. Segmentation is a just a part of it big chain that may involve segmentation, temporary classification, fusion, exploitation of contextual information etc. Many people believe that segmentation should be perfect at first time which is a fallacy. You can modify your segments as more information becomes available during the analysis. Typically in my any project I use segmentation at least 10 times. Yes at least 10 times .One of  the underutilized feature of eCognition is “Image Object Fusion” algorithm.The algorithm is an essential part of "iterative segmentation and classification" approach of GEOBIA. In this blog, I will show an example of image object fusion for classification of water bodies in a small remote sensing image. The step involves:
  1. Segmentation
  2. Initial classification of water
    1. Establishment of customized feature RationNIR 
      • RationNIR = (meanNIR/(meanR+meanB+meanG+meanNIR))*100
    2. Classify objects that satisfy property
      • RationNIR  less than 15 
      • Area greater than 10 pixels ( to avoid small shadows)
  3. Image object fusion using PPO ( Parent Process Object) to get whole water body
    1. Starting from water classified in step 2, check neighboring water objects and if difference between water object and neighboring objects is less than 5 in RatioNIR. Run in a loop.
    2. Process all water objects. 
Original image
Initial segmentation
Initial water classification
Final segmentation after image object fusion
Final water classification using image object fusion
Very powerful image object fusion algorithm

Step 3 is a one liner algorithm using "Image object Fusion".  Notice various parameters like Class filter, candidates classes, fitting function threshold, use absolute fitting value and weighted sum.To help you understand, I have made a "gif" to elaborate what is going on.

Blue: Initial water
Yellow: Active object
Red: Fused water after image object fusion


Here is the whole Rule set for water classification with image object fusion.

Friday, 10 October 2014

QGIS tutorial: Display with color symbology from data defined properties of shape files


How many of you have this problem: you classify your images in ecognition or any other software and exported classified image as shape file. Now you want to view the shape file in a GIS environment and with the same color for each class that was used in eCognition. Manually matching color RGB values from eCognition to shape colors for each class is a tedious task, specially when  you have many classes.

This problem can be solved with a little trick.

  • Do your classification in eCognition. Assign class colors as you wish.

  • Export classification result as shape file with Class attributes.

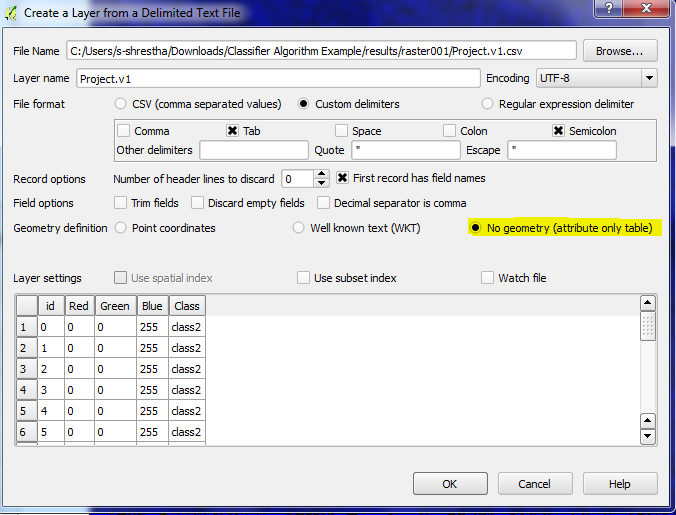
  • Export classification result as thematic raster. By doing so, you will get a CSV file in which you can get RGB color codes for each class.

  • Load your shape file in GIS (I use QGIS which is free. I am a poor guy therefore I always love free stuffs)

  • Load the CSV file in QGIS

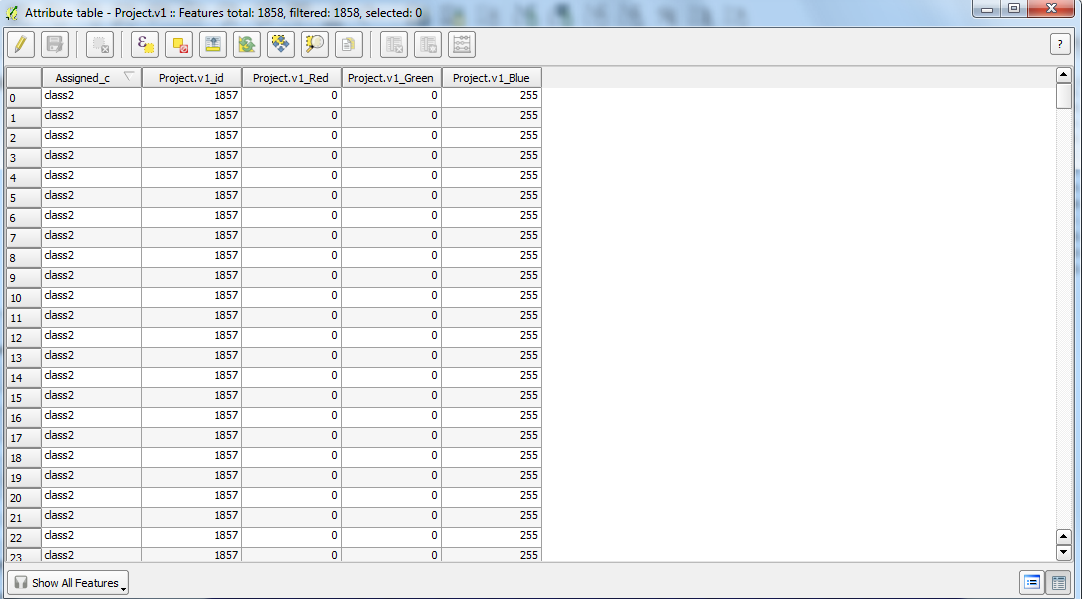
  • Perform attribute Join of shape file and CSV file with key attribute join based on Class. With this you will get RGB values attached in attribute table of shape file.

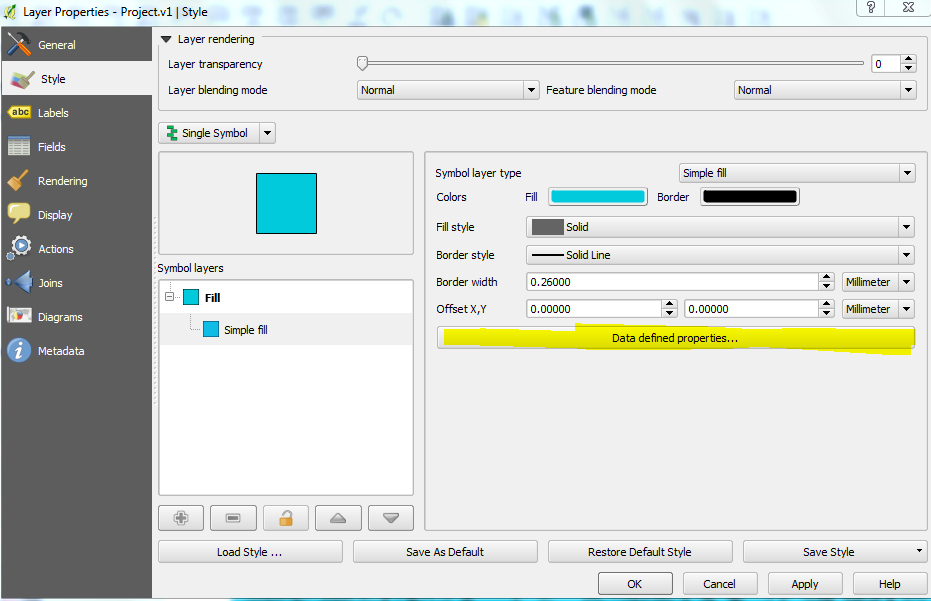
  • Double click color symbology of shape file and use data defined properties of  color attributes  of shape file.

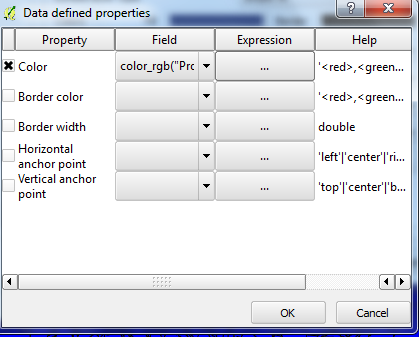
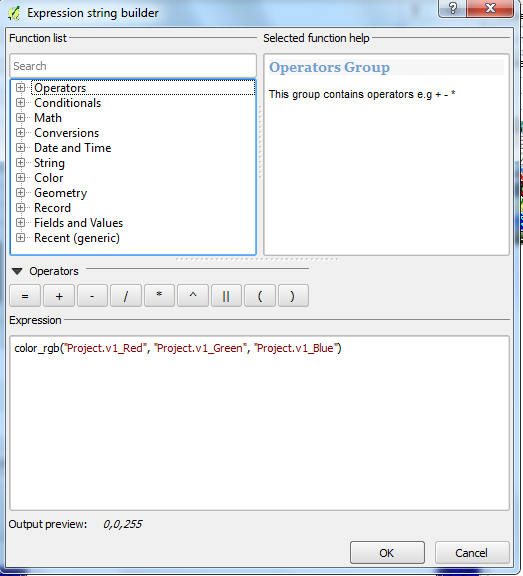
  • Build an expression for color selecting respective color attribute column from shape file.
import CSV file into QGIS

Attribute of shape file after performing join
Data defined properties
data defined properties for color

data defined properties for color
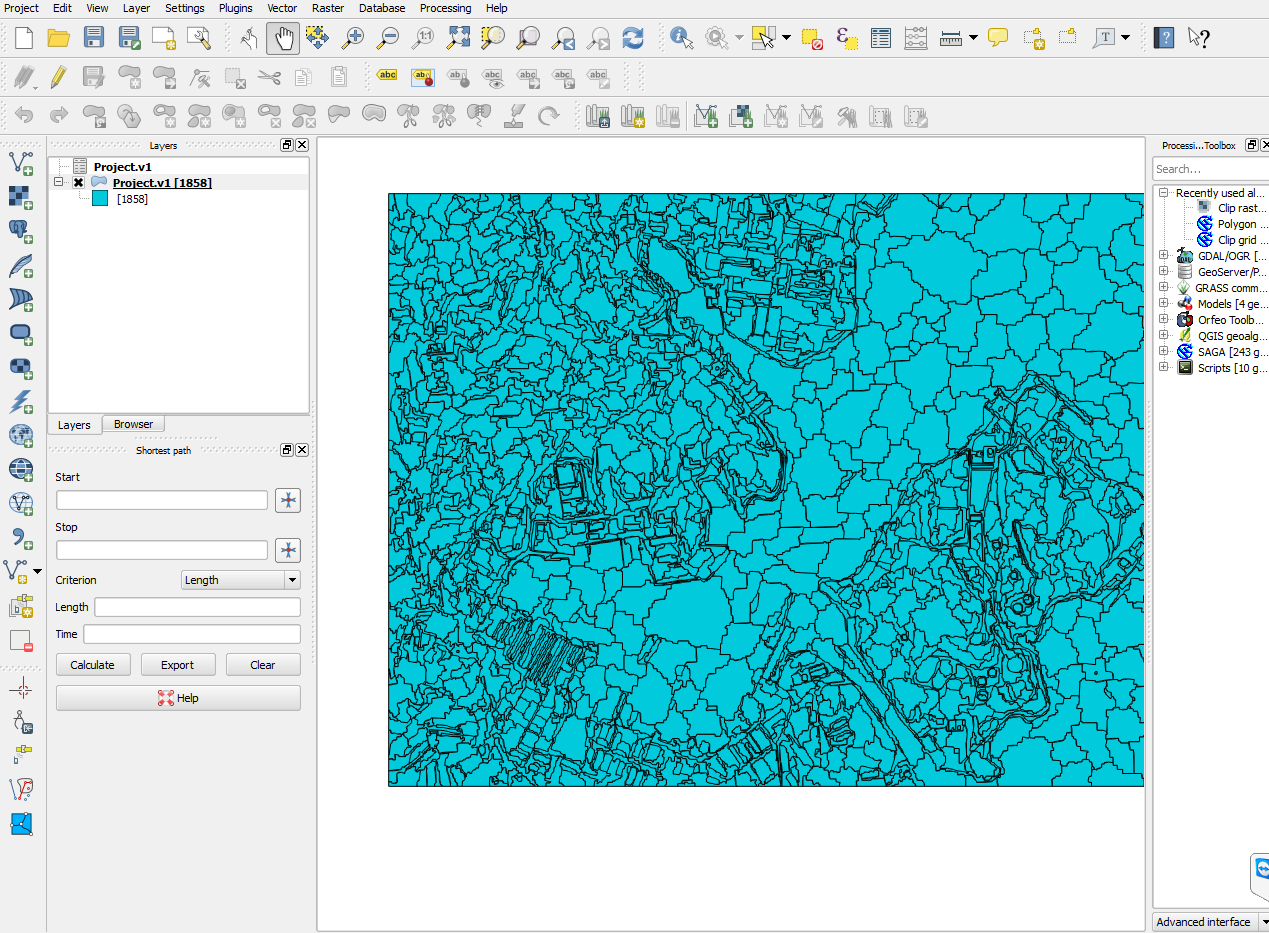
Normal display without color symbology

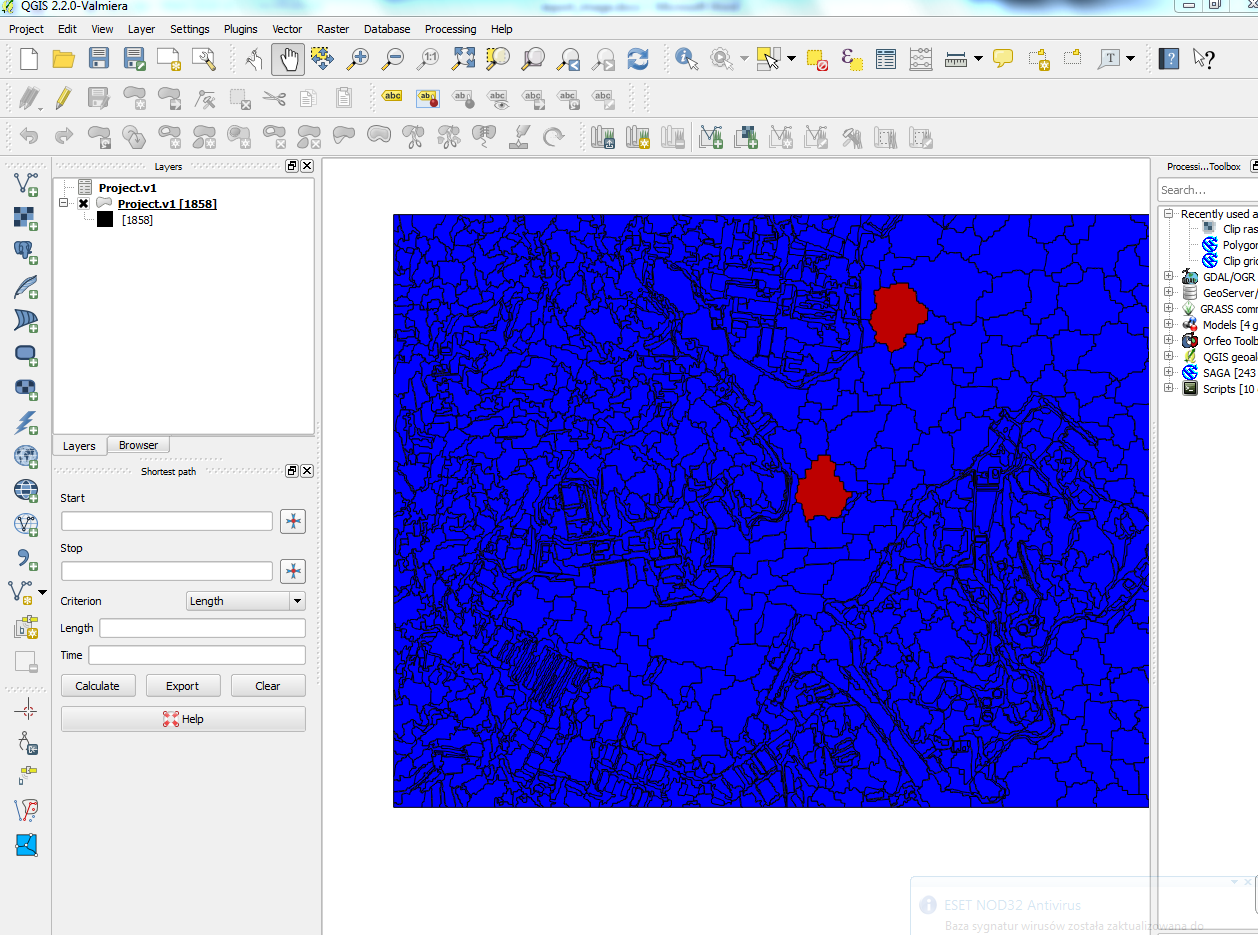
Display with color symbology


Wednesday, 8 October 2014

eCognition tutorial: Exporting eCognition features as images with array functionalities

There are instances when one would like to export different features from eCognition as a images to perform some tasks outside eCognition. eCognition doesn't provide a way to export many object features as images but it is only possible to export as a thematic raster in which each object has a unique ID, and features values are stored in a separated CSV file. To convert it into images, one has to mapped ID raster tiff file and data from CSV file.

If you want to get eCogntion features as images in an automatic way that can export any numbers of features as images in one go, then here is a way. For the purpose, we are going to utilize array handing capabilities of eCogntion and export each feature as separate tiff (My_1.tiff, My_2.tiff …. and so on) file. The rule set can be downloaded here. The rule set is flexible in the sense that you just have to update an array to store your feature list of interest. Number features can be any number (10, 20 or even 100 features). We will merge it afterwards in open source QGIS.

  • Perform a segmentation
  • Create a array and store features you want to export as images
  • Loop over the array
    1. For each feature, create a temporary image file
    2. Export the temporary file as a unique name
    3. Repeat until all features in the array are executed
  • Now in QGIS, we use GDAL to stack individual images into one single image. We will use merge function of GDAL (Raster>Miscellaneous> Merge).
    Complete ruleset within eCognition
Ruleset  for exporting features as images 
GDALmerge function within QGIS
Color composite of three merge features
Thus produced merge features image now can be used for classification  in ENVI, ERDAS IMAGINE or writing custom script in Python or MATAB. Personally I use such images within Python using scikit-learn library.

Friday, 15 August 2014

eCognition tutorial: Exporting eCognition classification file to ENVI

The problem:

I was wondering if anyone could help me export a usable file from eCognition Developer for use in ENVI 5.0? I've classified an image using Multiresolution Segmentation followed by the Classification algorithm using selected samples from the Standard Nearest Neighbour and everything worked so far. I try and export it as an ENVI-supported file type (e.g. *.tif) the raster seems to have "lost" all the classification- leaving a grayscale image- useless! I have been able to open a *.jpg file, but as it is an image it has lost any previous classfication from Ecognition.

Solution:

This is not even a problem but for people who are just starting with ENVI is a big HEADACHE. It’s just a matter of a symbology. If you have been using the ENVI for a while you should know that ENVI uses two files for any image. One binary file and another hdr file where different information about the binary image are stored. One can simply open hdr files with a notepad. Normal raster images have “file type = ENVI Standard” whereas classification images have “file type = ENVI Classification” and some other information such number of classes, class names and class colours. So the classified tiff file that one exports from eCognition does not have those information, hence ENVI opens the classified tiff file as a normal file. There are values differentiating classes but colour information are lost. This is a problem if you want to do some other operation in ENVI that required a classification image as input.

So we need to convert it ENVI Classification type, somehow. So here is a way to do it.

  1. Do your classification in eCognition.
  2. Export it using “export thematic raster files” algorithm in eCognition with Export Type Don’t forget to select your classes in Class Filter parameters
  3. Once you export it, you will have two files. One *.tiff file and other *.csv fil. Open *.csv file, there you will find class names and RGB colour for each class.
  4. Open *.tif file in ENVI.
  5. Then File> File Save as > ENVI Standard>Import file > Pick recently open tif file. Give a name and save it. Now you changed tiff file to ENVI file but remember, its still a normal ENVI standard file.
  6. Open the file created in step 5. Then File> Edit Header Info > Select File type as ENVI classification. It will prompt you for number of classes, class names, colour information. Provide those information by using *.CSV file that you opened in step 3.
  7.   Now you have a ENVI classification image with same class names and colour as in eCognition. Now smile and go for a coffee.

Example of a CSV file
Converting tiff file to ENVI file
Modifying header files
Editing class names and color information

Initial and Final image

Friday, 11 July 2014

Data exchange between MATLAB and Python: Reading and writing .mat fileswith Python

I am a MATLAB guy. I love MATLAB. I started with Fortan during my first degree at my Bachelor level. I came across with MATLAB only in year 2010 as a part of my Msc studies. Since then I been using it continuously for various tasks. Just recently, I started  using Python and I LOVE IT. The biggest reason being that Python is open-source and there are lots of Python libraries that can be used. But there are times; I have to shuffle data between MATLAB and python, because for some tasks I prefer MATLAB as I am accustom to it. So if you are in the same boat, then here I show you simple way to transfer data between MATLAB and Python. One has to use scipy.io module in Scipy for that purpose. If you have some old data or got some data online that are saved as MATLAB’s .mat file format, you can simply import it as:

import numpy as np
import scipy.io as sio
mydata = sio.loadmat('mydata.mat')

Now your mydata contains a dictinary with keys corresponding to the varible names saved in the original mydata.mat Saving a python variable to .mat file is also straight forward

# write one variable
x = np.arange(1,10,1)
# file name of the file
fname ='export_from_python.mat'
sio.savemat(fname, {'x':x})

When you read export_from_python.mat, you will get 'x' varialbe into MATLAB. If you want to write more than two variable:

# write two variables
x = np.arange(1,10,1)
y = np.ones((5,5))
fname ='export_from_python_1.mat'
sio.savemat(fname, {'x':x, 'y':y})

I do lot of work with classification of remote sensing images using many different types of machine learning algorithms. Proprietary software like ENVI and ERDAS are not flexible enough for me, as these software donot allow an efficient way to tune hyper-parameters that are algorithm specific. I dont like training models with defualt parameters. I do my model traning and classification in python. Here is the typical workflow.
  1.  Import image and training data in python using GDAL
  2. Train machine learning model in python using Sci-kit Learn
  3. For accuracy assessment, i do it within python but for accuracy assessment visualization, i export  targets and outputs vectors from Python to MATLAB
  4. Use 'plotconfusion' function from Neural Network toolbox for a visualization of confusion matrix. Here is the confusion Matrix  information that i got from MATLAB. Its nice, isnt it ?

Picture1
Confusion matrix