I came back after a really long time. I promise that I will try to update it more frequently. Some months ago, I established this blog and added some post but without much description for users. If you are wondering what those posts are really about, I have fully formatted nice article of my mine explaining the detailed procedure to create those embedding Google Maps and Google Earth. Interested readers can read the paper and have a look on my previous post in following order to understand the whole process.
1) Embedded Google map created from Google Fusion Table
2) Google Earth Embedding
3) Area of Germany by Federal states dispalyed as Markers
4) Area of Germany by Federal States displayed as Regions
Tuesday 30 November 2010
Data Visualization Using Google Maps: the Hard Way and the Easy Way
I came back after a really long time. I promise that I will try to update it more frequently. Some months ago, I established this blog and added some post but without much description for users. If you are wondering what those posts are really about, I have fully formatted nice article of my mine explaining the detailed procedure to create those embedding Google Maps and Google Earth. Interested readers can read the paper and have a look on my previous post in following order to understand the whole process.
1) Embedded Google map created from Google Fusion Table
2) Google Earth Embedding
3) Area of Germany by Federal states dispalyed as Markers
4) Area of Germany by Federal States displayed as Regions
1) Embedded Google map created from Google Fusion Table
2) Google Earth Embedding
3) Area of Germany by Federal states dispalyed as Markers
4) Area of Germany by Federal States displayed as Regions
Google Fusion Table Just Got Better
Few months ago, i have posted a blog demonstrating how easy it is to display spatial data in Google Maps using Google Fusion table. Today, i just found that Google Fusion table has improved! Previously, it was only possible to display markers as default red marker but now it's easy to choose from a set of markers. Google fusion table has published approximately 200 additional marker names recognized by Fusion Tables. You can also visually examine what those additional markers in this link.You can click in a markers and get the name of that marker. Just place a column in your own table as a TYPE and put appropriate name of the markers which best describes your point. You will find additional tab Configure Style when you visualize your data as map. Click it and select column tab to select your type column in your data. And it's done.
Here is the same data that I used before displayed with different markers. It looks more eye pleasant than the one before. Don't you agree? I remember that when I want to build similar kind of map using Google API for Flex, it took me app. 10 days to learn Flex and build something similar. But, using Google Fusion table, it took me just 5 minutes. GOOGLE is just great.
Despite these improvements, I am yet to be satisfied with Google Fusion table. Why not to allow a user to match his Type column to available list of markers? Then user doesn't have to alter his data. For example, I had a type "Essen" (German word which literally means to eat) to represent Restaurant in my data set but then i had to change that to "dining" to match with available marker list. Why don't they add a feature to link my "Essen" to their " dining" so I don't have to change my dataset?
Google Engineers, are you listening? I think this feature will be added in next update.
Advanced PDF export from ArcGIS
Starting from ArcGIS 9.3, now it is easy to create advanced PDF type export where user can can interactively query the attributes of vector features. Create your map in arc gis in a usual way and follow these simple steps. It is to be noted that user needs recent version of Arcrobat Reader 9.0. I will show this capability of ArcGis by making a simple map of the world.
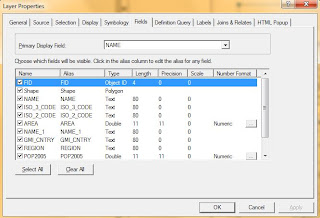
1) Double click the desired layer in ArcGIS 9.3 and go to Field tab. Select fields that you want to display in the PDF. Select the attribute that you want to display as primary display field. Thus selected field will be displayed as a list in the PDF which will be subsequently created.

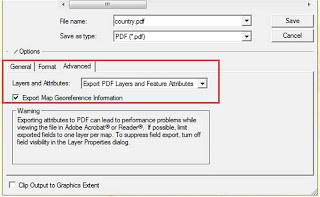
2 ) Go to the MAP view of arc gis and then click File> Export Map. Choose file type as PDF and click Advanced tab. Select Export PDF layers and Features Attributes as shown in below.

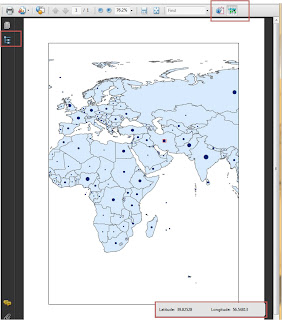
3) Save the file and open it in Acrobat reader 9.0.
4) Right click any where near toolbar and add Analysis toolbar. Now hover around the map you created before hand, bingo look at the bottom of the window, you will see the longitude and lattitude information of the place as you hover around the map.

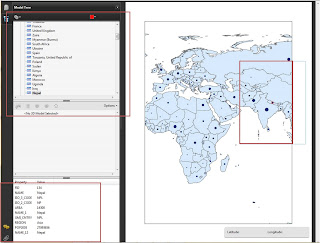
Also notice that at the left hand side, you have a Modal tree Tool. Click the tool and expand its view. Now you can find the list of all features. Click in one the features name and in the bottom, you can see its features. You can also use FIND tool and search for a feature. PDF will locate that particular feature for you.

Isn't it cool. Now you can create complicated map in ArcGIS and share it with other non technical peoples as a PDF where attributes of features can be viewed and queried.
1) Double click the desired layer in ArcGIS 9.3 and go to Field tab. Select fields that you want to display in the PDF. Select the attribute that you want to display as primary display field. Thus selected field will be displayed as a list in the PDF which will be subsequently created.

2 ) Go to the MAP view of arc gis and then click File> Export Map. Choose file type as PDF and click Advanced tab. Select Export PDF layers and Features Attributes as shown in below.

3) Save the file and open it in Acrobat reader 9.0.
4) Right click any where near toolbar and add Analysis toolbar. Now hover around the map you created before hand, bingo look at the bottom of the window, you will see the longitude and lattitude information of the place as you hover around the map.

Also notice that at the left hand side, you have a Modal tree Tool. Click the tool and expand its view. Now you can find the list of all features. Click in one the features name and in the bottom, you can see its features. You can also use FIND tool and search for a feature. PDF will locate that particular feature for you.

Isn't it cool. Now you can create complicated map in ArcGIS and share it with other non technical peoples as a PDF where attributes of features can be viewed and queried.
Advanced PDF export from ArcGIS
Starting from ArcGIS 9.3, now it is easy to create advanced PDF type export where user can can interactively query the attributes of vector features. Create your map in arc gis in a usual way and follow these simple steps. It is to be noted that user needs recent version of Arcrobat Reader 9.0. I will show this capability of ArcGis by making a simple map of the world.
1) Double click the desired layer in ArcGIS 9.3 and go to Field tab. Select fields that you want to display in the PDF. Select the attribute that you want to display as primary display field. Thus selected field will be displayed as a list in the PDF which will be subsequently created.
2 ) Go to the MAP view of arc gis and then click File> Export Map. Choose file type as PDF and click Advanced tab. Select Export PDF layers and Features Attributes as shown in below.
3) Save the file and open it in Acrobat reader 9.0.
4) Right click any where near toolbar and add Analysis toolbar. Now hover around the map you created before hand, bingo look at the bottom of the window, you will see the longitude and lattitude information of the place as you hover around the map.
Also notice that at the left hand side, you have a Modal tree Tool. Click the tool and expand its view. Now you can find the list of all features. Click in one the features name and in the bottom, you can see its features. You can also use FIND tool and search for a feature. PDF will locate that particular feature for you.
Isn't it cool. Now you can create complicated map in ArcGIS and share it with other non technical peoples as a PDF where attributes of features can be viewed and queried.
1) Double click the desired layer in ArcGIS 9.3 and go to Field tab. Select fields that you want to display in the PDF. Select the attribute that you want to display as primary display field. Thus selected field will be displayed as a list in the PDF which will be subsequently created.

2 ) Go to the MAP view of arc gis and then click File> Export Map. Choose file type as PDF and click Advanced tab. Select Export PDF layers and Features Attributes as shown in below.

3) Save the file and open it in Acrobat reader 9.0.
4) Right click any where near toolbar and add Analysis toolbar. Now hover around the map you created before hand, bingo look at the bottom of the window, you will see the longitude and lattitude information of the place as you hover around the map.

Also notice that at the left hand side, you have a Modal tree Tool. Click the tool and expand its view. Now you can find the list of all features. Click in one the features name and in the bottom, you can see its features. You can also use FIND tool and search for a feature. PDF will locate that particular feature for you.

Isn't it cool. Now you can create complicated map in ArcGIS and share it with other non technical peoples as a PDF where attributes of features can be viewed and queried.
Subscribe to:
Posts (Atom)